Rethinking the CIO Dashboard (Part 2: Tying IT Spend To Business Results)
This is second in a series of four blog posts on research from Forrester on how IT leaders can rethink the CIO dashboard to communicate the value of IT to the business. You can find the first post here.
CIOs are struggling with communicating the value of IT to the business. That’s a key finding from a Forrester and TBM Council survey to evaluate the impact of current business imperatives on the metrics that CIOs use to convey the performance and contribution of technology to business goals.
Traditional measures of IT focus exclusively on operational metrics and don’t make them relevant to business leaders. This has led to two major problems: First, a significant gap in perceptions about the value and contribution of technology to the organization, and second, a lack of alignment between business goals and IT measures — leading to costly mistakes.
The Disconnect Between IT and the Business
Specifically, half the business leaders surveyed feel that IT is holding back the business — a very strong testament to the communication disconnect. Business leaders also estimate that IT spending is roughly 8% of their revenue, whereas, in reality the number is 5% — leading to missed expectations.
Another challenge that surfaced in the survey is that while many organizations’ IT metrics are predominantly transaction-focused, CIOs and business leaders are also looking to measure and communicate IT’s contribution to business outcomes and the ability to respond to market changes.
CIO KPIs and Dashboards play an important role in helping address and eliminate this disconnect between IT and the Business.
Architecting an Improved CIO Dashboard
According to Forrester, the ideal scorecard is not only in sync with the business outcomes but also takes into account the maturity of existing measurements, perceptions of the business executives, and culture of the company. It’s also the beginning of conversations — not the end.
There are three specific issues that the ideal CIO dashboard must address:
- Show business leaders not just the costs but also the benefits of spending on IT
- Measure and Communicate how IT Is helping deliver agility
- Make a direct connection between IT investments and customer satisfaction
In their report, Forrester proposes a four-quadrant BT value scorecard. The four perspectives are health, delivery, outcome, and agility. It is consciously designed to be relevant to both IT and business audiences. The scorecard abstracts the typical IT operational metrics up a level to show the relationship between IT activities and business outcomes.
Outcome KPIs that tie Technology Spending to Business Results
Outcome KPIs ensure the linkage between spending and business results. Measuring and communicating these KPIs can ensure joint accountability and ownership of business- or customer-focused systems.
Said the SVP of marketing at a services company: “We [all the executives] are all measured on revenue. Overall revenue of the company and the revenue of strategic big buckets. Revenue growth is the most important.” CIOs can act as the glue that provides data on variables to understand their impact on outcomes.
Forrester recommends the following domains for outcome KPIs:
- Financial measures: Many CIOs focus on the cost of technology, while business leaders want the value. They want to understand the benefit statements as well as the cost in relation to revenue or growth. So KPIs like “Yr/Yr IT budget growth versus revenue growth” and “percentage of IT spend on run, grow, change the business” are good starting points.

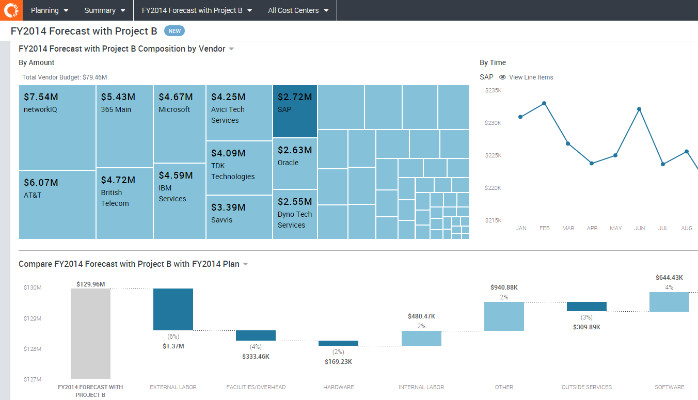
Image 1: Project spend by investment type in Apptio Cost Transparency
- Market dynamics: CIOs need to be in tune with changing market dynamics by developing insights from data that already exists in corporate systems. There are many valuable sources such as business partners, employees, service providers, and most importantly, your customers. KPIs such as retention rates for certain customer segments, conversion rate for marketing campaigns, or tracking global regulatory and risk exposure would highlight IT contribution to achieving business outcomes.
- Industry/sector KPIs: Many of the outcome KPIs are also very industry-specific and so there are no standard examples. Every industry has its own set of business KPIs. For example, the insurance industry measures claims ratio as total claims per period/total earned premiums per period. CIOs must be well versed in these ratios and be able to articulate their contribution to these ratios. One CIO of a healthcare organization we talked to said, “We measure the time it takes for physicians to do certain tasks with the goal of reducing it so the physicians can spend more time on patient care.”
Contact us today to see how Apptio can help you implement a Business Value Scorecard in your organization.
The Business Value Scorecard is a key element of Technology Business Management (TBM). See why Forrester thinks IT leaders need to adopt TBM now, the 4 steps of TBM adoption, and how to overcome major objections to adopting TBM in your organization.
Chris
Managing Partner - TLC Gift Boxes LLC
9yA Fresh Eyes approach to an old issue.