Who moved my 99th percentile latency?
April 8, 2015
Co-author: Cuong Tran
Longtail latencies affect members every day and improving the response times of systems even at the 99th percentile is critical to the member's experience. There can be many causes such as slow applications, slow disk accesses, errors in the network, and many more. We've encountered a root cause of microbursting traffic which cannot be easily solved by the hedging your bet strategy, i.e, sending the same request to multiple servers in hopes that one of the servers will not be impacted by longtail latencies. In this following post we will share our methodology to root cause longtail latencies, experiences, and lessons learned.
What are longtail latencies?
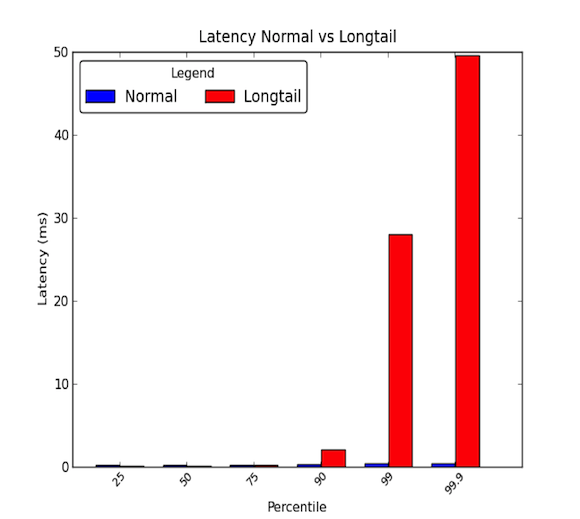
Network latencies between machines within a data center can be low. Generally, all communication takes a few microseconds, but every once in a while, some packets take a few milliseconds. The packets that take a few milliseconds generally belong to the 90th percentile or higher of latencies. Longtail latencies occur when these high percentiles begin to have values that go well beyond the average and can be magnitudes greater than the average. Thus average latencies only give half the story. The graph below shows the difference between a good latency distribution versus one with a longtail. As you can see, the 99th percentile is 30 times worse than the median and the 99.9 percentile is 50 times worse!
Longtails really matter!
A 99th percentile latency of 30 ms means that every 1 in 100 requests experience 30 ms of delay. For a high traffic website like LinkedIn, this could mean that for a page with 1 million page views per day then 10,000 of those page views experience the delay. However, most systems these days are distributed systems and 1 request can actually create multiple downstream requests. So 1 request could create 2 requests, or 10, or even 100! If multiple downstream requests hit a single service affected with longtail latencies, our problem becomes scarier.
To illustrate, let's say 1 client request creates 10 downstream requests to a longtail-latency affected subsystem. And assume it has a 1% probability of responding slowly to a single request. Then the probability that at least 1 of the 10 downstream requests are affected by the longtail latencies is equivalent to the complement of all downstream requests responding fast (99% probability of responding fast to any single request) which is:

That’s 9.5 percent! This means that the 1 client request has an almost 10 percent chance of being affected by a slow response. That is equivalent to expecting 100,000 client requests being affected out of 1 million client requests. That's a lot of members!
However, our previous example does not consider that active members generally browse more than one page and if that single user makes the same client request multiple times, the likelihood of the user being impacted by latency issues increases dramatically. Therefore, a very active backend service affected by longtail latencies can have a serious site-wide impact.
Case Study
We recently had the opportunity to investigate one of our distributed systems which experienced longtail network latencies. This problem had been lurking for a few months with cursory investigations not showing any obvious reasons for the longtail network latencies. We decided to take a more in-depth investigation to root cause the issue. In this blog post, we wanted to share our experience and methodology that we used to identify the root cause through the following case study.
Step 1: Have a Controlled and Simplified Environment
We first set up a test environment of the actual production system. We simplified the system to a few machines which could reproduce the longtail network latencies. Furthermore, we turned off logging and persistence cache data on the disk to eliminate IO-stress. This allowed us to focus our attention on key components such as CPU and the network. We also made sure to set up simulated traffic runs that we could repeat in order to have reproducible tests while we performed experiments and tunings on the systems. The diagram below shows our test environment which consisted of an API layer, a cache server, and a small database cluster.

At a high level, requests from external services come in to the distributed system through an API layer. Requests are then made to a cache server to fulfill queries. If the data is not in the cache, the cache server will make requests to the database cluster to form the query response.
Step 2: Measure End-To-End Latency
The next step was to look at detailed end-to-end latencies. By doing so, we could attempt to isolate our longtail latencies and see which component in our distributed system affected the latencies we were seeing. During a simulated traffic run, we used the ping utility between the various pairs between an API layer host, a cache server host, and one of the database cluster hosts in order to measure the latencies. The following shows the 99th percentile latencies between the pair of hosts:

From these initial measurements, we concluded that the cache server had the longtail latencies issue. We experimented more to verify these findings and found the following:
- The major issue was the 99th percentile latencies for inbound traffic to the Cache Server.
- 99th percentile latencies were measured to other host machines on the same rack as the cache server and no other hosts were affected.
- 99th percentile latencies were then also measured with TCP, UDP, and ICMP traffic and all inbound traffic to the Cache Server was affected.
The next step was to break down the network and protocol stack of the suspected cache server. By doing so, we hoped to isolate the piece of the cache server that impacted the longtail latencies. Our end-to-end breakdown latency measurements is shown below:

We made these measurements by implementing a simple UDP request/response application in C and used timestamping provided by the Linux system for network traffic. You can see an example in the kernel documentation for the features in timestamping.c to get detailed information on when the packets hit the network interface card and sockets. It is also worth noting that some network interface cards provide hardware timestamping which allow you to get information on when packets actually go through the network interface card; however, not all cards support this. You can see this document by RedHat for more information. We also used tcpdumps on the system to be able to see when requests/responses are processed at the protocol level by the operating system.
Step 3: Eliminate and Experiment
After we identified that the latency issue was between the network interface card hardware and the protocol layer of the operating system, we focused heavily on these portions of the system. Since the network interface card (NIC) could have been a possible issue, we decided to examine it first and work our way up the stack to eliminate the various layers. While looking at each component, we kept the following in mind: Fairness, Contentions, and Saturation. These three key areas help to find potential bottlenecks or latency issues.
- Fairness: Are entities in the system receiving their fair share of time or resources to process or complete? For example, is each application on a system receiving a fair amount of time to run on the CPUs to complete their tasks? If not, is the unfairness or fairness causing an issue? For example, maybe a high-priority application should be favored over others; real-time video requires more time to process than a background job that allows you to back up files to a cloud service.
- Contentions: Are entities in the system fighting for the same resource? For example, if two applications are writing to a single hard drive, both applications must contend for the drive bandwidth. This relates heavily to fairness since contentions must be solved through some sort of fairness algorithm. Contentions may be easier to look for instead of a fairness question.
- Saturation: Is a resource being over or completely utilized? If a resource is being over or completely utilized, we may hit some limitation that creates contentions or delays as entities have to queue up to use the resources as they become available.
When we tackled the NIC, we focused mainly on looking at a) whether queues were overflowing, which would show as discards and indicate possible bandwidth usage limitations or b) if there were any malformed packets needing retransmissions, which could cause delays. There were 0 discards and 0 malformed packets hitting the NIC during our experiments and our bandwidth usage was roughly 5 - 40 MB/s which is low on our 1 Gbps hardware.
Next, we focused on the driver and protocol level. These two portions were difficult to separate; however, we spent a good portion of our investigation looking at different operating system tunings that dealt with process scheduling, resource utilization for cores, scheduling interrupt handling and interrupt affinity for core utilizations. These key areas could potentially cause delays in processing network packets and we wanted to make sure requests and responses were being serviced as fast as the machine could handle. Unfortunately, most of our experimentation yielded no root cause.
The symptoms we saw in the beginning seemed to imply a bandwidth limited system. When a lot of traffic is produced, latencies increase due to queueing delays. Yet, when we looked at the NIC layer, we did not see such an issue. But after we eliminated almost everything in the stack, we realized that our performance metrics measure in 1 second or 1,000 millisecond granularities. With a 30 ms longtail latency, how could we possibly hope to catch the problem?
Microbursts, oh my!
Many of our systems have 1 Gbps network interface cards. When we looked at the incoming traffic, we saw that the Cache Server generally experienced 5 - 40 MB/s traffic. This kind of bandwidth usage does not raise any red flags; however, what if we looked at bandwidth usage per millisecond! The first graph below is of bandwidth usage per second and shows low usage, whereas the second graph is of bandwidth usage per millisecond and shows a completely different story.

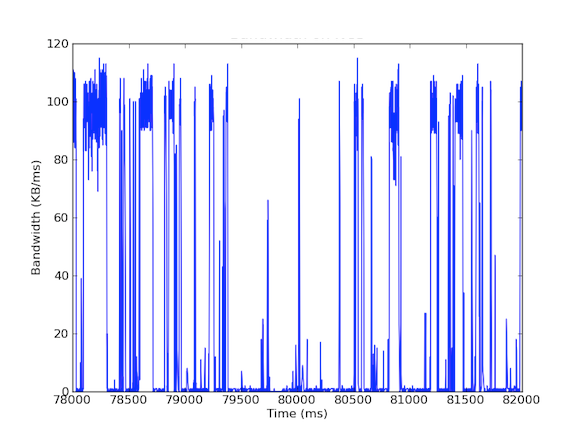
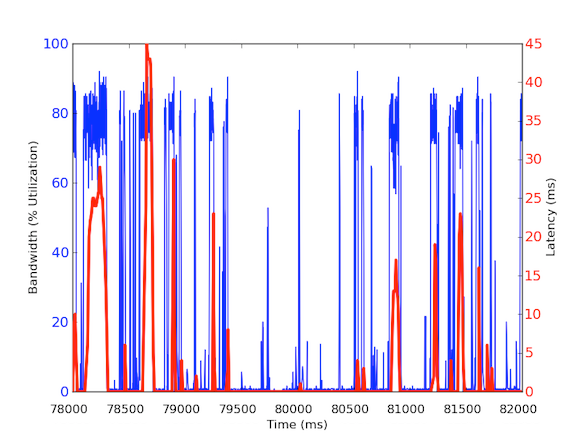
To measure per millisecond incoming bandwidth traffic, we used tcpdump to gather traffic for a set period of time. This required offline calculations, but since tcpdumps have timestamps at the microsecond level, we were able to calculate the incoming bandwidth usage per millisecond. By doing these measurements, we were able to identify the cause of the longtail network latencies. As you can see in the above graphs, the bandwidth usage per millisecond shows brief bursts of few hundred milliseconds at a time that reach near 100 kB/ms. Such a rate of 100 kB/ms sustained for a full second would be equivalent to 100 MB/s, which is 80% of the theoretical capacity of 1 Gbps network interface cards! These bursts are known as microbursts and are created by the distributed database cluster responding to the cache server all at once thus creating a fully utilized link for sub-second time. Below is a graph of bandwidth utilization as a percentage of 1 Gbps speeds versus the latencies measured during the same time frame. As you can see, there is a high correlation between latency spikes and the bursty traffic:
These graphs show the importance of sub-second measurements! Although it is difficult to maintain a full infrastructure with such data, at least for deep-dive investigations, it should be a go to granularity because in performance, milliseconds really matter!
Impact of Root Cause
This root cause has an interesting effect on our distributed system. Generally systems like high throughput, therefore having extremely high utilization is a good thing. But our caching server deals with two types of traffic: (1) high throughput data from the database (2) small queries from the API Layer. Granted, the API Layer requests can cause the high throughput data from the database, but here is the key: It is only needed when the request cannot be fulfilled by the cache. If the request is in cache, the caching server should return data quickly without having to wait on database calculations. But what happens if a cached request comes in during a microburst response for a non-cached request? The microburst can cause 30 ms of delay to any other incoming traffic and therefore the cached request could experience an extra 30 ms of delay that is completely unnecessary!
Step 4: Prototype and Validate
Once we discovered a plausible root cause, we wanted to validate our results. Since this bursty bandwidth usage can cause delays to cache hits, we could isolate these requests from cache server's queries to the database cluster. In order to do this we set up an experimental environment where a single cache server host has two NICs, each with their own IP addresses. With this setup, all API Layer requests to the cache server go through one interface and all cache server queries to the database cluster go through the other interface. The diagram below illustrates this:

With this setup we measured the following latencies and as you can see, the latencies between the API Layer and cache server are actually what we expect — healthy and below 1 ms. Latencies with the database cluster cannot be avoided without improved hardware; because we want to maximize the throughput, bursts are always going to occur and thus the packets will be queued up at the interface.

Therefore, different traffic deserves different priorities and can be an ideal solution to handle microbursting traffic. Other solutions include improving hardware such as using 10 Gbps hardware, compression of data, or even using quality of service.
Finding the root cause of longtails can be hard.
The root cause of longtail latencies can be difficult to find, as they are ephemeral and can elude performance metrics. Most performance metrics that we collect here at LinkedIn are at 1 second granularities and some at 1 minute. However, taking that into perspective, longtail latencies that lasts 30 ms can be easily missed by measurements with granularities of even 1,000 ms (1 second). Not only that, longtail latencies can be due to different issues in hardware or software and can be fairly difficult to root cause in a complex distributed system. Some examples of causes can be hardware resource usage dealing with fairness, contention, and saturation, or data pattern issues such as multi-nodal distributions or power users causing longtail latencies for their workloads.
To summarize we highly encourage remembering these four steps of our methodology for future investigations:
- Have a controlled and simplified environment.
- Get detailed end-to-end latency measurements.
- Eliminate and experiment.
- Prototype and validate.
Lessons learned
- Longtail latency is not just noise! It can be due to different real reasons and the 99th percentile requests can affect the rest of a large distributed system.
- Don’t discount the 99th percentile of latency issues as power users; as power users multiply, so will the issues.
- Hedging your bet although a generally good strategy where the system sends the same request twice in hopes for one fast response does not help when the longtail latencies are application induced. In fact, it just makes the system worse by adding more traffic to the system which in our case would cause more microbursts to occur. Had we implemented this strategy without a thorough analysis, we would have been disappointed because the system performance would have been degraded and it would have wasted a considerable amount of effort to implement such a solution.
- Scatter/gather approaches can easily cause microbursts of bandwidth usage, causing queueing delays on the millisecond granularity.
- Sub-second granularity measurements are necessary.
- Sometimes hardware improvements are the most cost-effective way to help alleviate the issues but until then, there are still interesting mitigations that developers can do, such as compressing data or being selective on what data is sent or used.
Finally, the most important lesson we learned was to follow methodology. Methodologies give direction to investigations, especially when things become confusing or begin to feel like a journey through Middle-earth.
Acknowledgements
I would like to thank Andrew Carter for his work and collaboration during the investigation and Steven Callister for providing operational support and feedback. Also thanks to Badri Sridharan, Haricharan Ramachandra, Ritesh Maheshwari, and Zhenyun Zhuang for their feedback and suggestions on this writing.