'Insight' POLITICO.eu's Playbook - A data-dive into what drives the day in Brussels
Daniel Fritz
Senior Digital Communications Advisor & Data Strategist. Working for the European cause.
TL;DR: A data-analyst throws an eye on what POLITICO Europe's playbook tells you beyond what first meets the eye thanks to publicly available data by Bitly*, the preferred link shortener used throughout the newsletter. These insights can inform your own newsletter campaign, can tell you much about the Brussels bubble and result in a real-time app, telling you what's driving Brussels' day.
Let's start with a coffee!
Every weekday morning, right after having prepared vast and absolutely necessary amounts of black coffee, I open my Gmail app, refresh and tap the latest playbook by Politico Europe's Ryan Heath - always with the hope to stumble upon a good story to share, talk about or look out for. And where else to look than in the self-proclaimed "must-read briefing on what's driving the day in Brussels" ?
But which of the stories will actually catch the bubble's attention? What's THE story I shall invest my precious morning time in? Can I trust my gut feeling? Should I rely on the playbook saying "have a look at this" ? Check out Social Media shares and chatter? All options have their pros and cons and all will yield results which will still leave you mostly in the dark.
All options but one: Bit.ly.
The link-shortener offers not just statistics for the link a user shortened but for all links shortened with the service. The average playbook in May 2015 contained 32 bit.ly shortened links and every links comes with a rich set of information attached to them: author, source, number of clicks etc.
Driven by the question if this information can help me identify "what's driving the day in Brussels", I downloaded the last available playbooks, extracted all encrypted short links, enriched them with information provided by the Bit.ly API as well as some meta information about ie the position of the link within the playbook and ran the whole through some analytics programs.
The resulting insights did not only allow to see which among the stories in the playbook are going to be clicked but also give some-behind-the-scenes views into the making and doing of the playbook and leaves one with some general conclusions about newsletters in Brussels.
So, how's the playbook doing?
With an announced more than 25.000 daily subscribers (April 2015), the European version of the playbook generated an average of 9200+ clicks per day in May 2015. The number of links and the number of clicks are positively correlated (R>.6). Hence, if POLITICO was playing it cheap, they could simply increase the number of links to generate more traffic.

Every link added to the playbook adds theoretically 225 additional clicks. The number of links explains up to 40% of the variation in clicks, which leaves still plenty of room for other factors to explain why a link is being clicked (topic, position in the playbook, copy ...)

Among the 660 links checked within this analysis, the following 16 were the most clicked (at least 1.000 clicks). It seems light content works best in the morning and some companies should send playbook some chocolate for bringing in some heavy traffic ( Itaka Media for their House of Cards version of Brussels and the German Tagesspiegel which has been mentioned for their - unfortunately too local, Berlin-focussed - version of a playbook called "Checkpoint" [is there potential for a German federal politics playbook?] ).
Political topics attracting attention are the #Brexit, Greece, Migration and the Digital Single Market:

Who writes the playbook?
Actually, this shouldn't even be a question, as the answer seems obvious: Ryan Heath. But bit.ly data, to some extent, shows us who else contributes to our daily morning reading, as shortened links are stored together with the people that created them (let's call them link providers). Mostly, playbooks also contain h/t's at the end to indicate contributions.
It turns out almost 80% of all links in the playbook come from its main author. Another 17% have been created by anonymous authors (Bit.ly does not return the original creator here for unknown reasons). An interesting, because unexpected outcome were authors cryptically named such as "o_43u4nj35nm". These authors contributed the remaining 3% of the links. Fortunately, a little trick also reveals who's behind them.
Link providers for the playbook:

Decrypted & significant other contributors:
Mike Allen (the author of the US playbook), the corporate PoliticoEurope Bit.ly account (which could also be used by RH), Daniel Lippman (Researcher/Reporter atPolitico and for Politico Playbook as indicated on his Twitter profile) and Jules Johnston (Web Editor at Politico Europe). As it turned out while writing this post, the largest cryptic contributor is also Ryan Heath via a second bitly account.
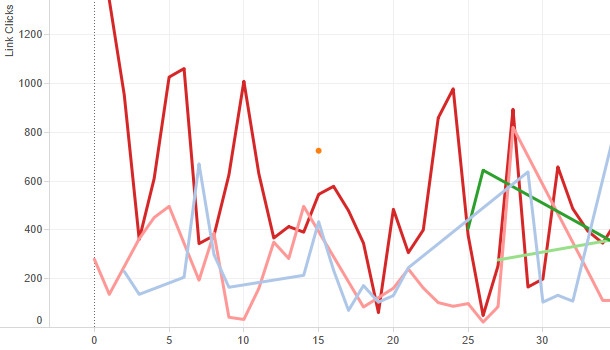
But what is each author's individual contribution to the success of the playbook? Below we'll see a rather packed chart showing a) the days of the week b) the total link number and individual position of each link per day, c) the number of clicks on all links on that position on that day and d) the link providers.
Without going much further into detail, we can observe 3 things:
- RH's links perform best, every day (with very few exceptions).
- The further down a link in the playbook, the less it is being clicked (With ONE notable exception: Tuesday, 5 May. A link to RH's birthday wishlist at the end of the playbook has been clicked >5.000 times. To date, the link does not lead anywhere anymore, but I hope the author got all that was on the list. nb: only about 1000 clicks are due to its mention in the playbook. the link existed already before 5 May.)
- Playbooks are longest on Mondays. (Playbooks start on Mondays with most information, as there was the weekend before to collect stories. Playbooks get shorter until Thursdays, before they are having more links on Fridays - maybe because Plux chatter delivers fresh input ?)

What's next?
Some clever blog analysts' work tells me that this post is long enough already, but there are more opportunities to dive even deeper into the data: a minute-by-minute breakdown of the clicks to find the optimal time to send out a newsletter to the Brussels bubble to increase click-throughs for example. One could also analyse the media mix of the links - how often does the playbook link to POLITICO's own sources, how often to others - and what are the other sources the playbook reads? Which of them have the most interesting stories and create the most clicks?
Also interesting: are most clicked stories really talk of the town (in terms of social media mentions)? That is, is the playbook really talking about what will drive the day in Brussels? The same data collection methods could be applied to the US version to see which 'capital' has the more engaged newsletter readers and if/where they differ in taste, topics, timing etc... Finally, there is also the question if people actually click on these native ad links in the newsletter (hint: yes!).
Most interesting: setting up a simple app which tells and ranks you instantly which links in today's playbook have been clicked most.
I'm interested to receive your comments on what you would like to know about what drives the Brussels bubble or what else would you like to lay a "data eye" on!
* The data in this analysis covers POLITICOEurope's playbooks from 4 May to 29 May. Older playbooks were not available on politico.eu's website at the time. All data has been obtained via Bit.ly's public API.
Senior Digital Communications Advisor & Data Strategist. Working for the European cause.
8yMarco Ricorda he placed it in the newsletter back then! Still tremendously honoured! The analysis launched some very interesting debates which will make for some hopefully just as insightful blog posts in 2016.
🌐 Modern International Communication Operations 🌐 | Communication consultant | Certified Trainer | Certified Public Speaking Coach | Science & AI communication |
8yWell done Dan, quite an analysis there. I expect Ryan Heath to at least give it a like! :)
Founder of bridge_ci - AI, Alternative data, LLMs, OSINT, and alternative data for corporate strategy, private equity, and public affairs.
8yHere's some external EU trends from a bit ago that I wrote if that interest anyone. http://intelligencecommunicationschange.com/2015/03/01/the-european-parliament-this-week/
Video Maker
8yHi Daniel Fritz, thanks for this great analysis! A nice box of chocolate for the POLITICO Europe Playbook is on its way!
PPTA, Lead for Communications, Europe
8yVery insightful. Thanks for that Daniel. I have looked into implementation of attention minutes in a blog. This data provides answers to questions, "Is your content being read? Where exactly do readers lose interest? What gets readers to act on the content?" It would be interesting to read your take on attention minutes.