Taming Database Replication Latency by Capacity Planning
May 19, 2014
Web companies like LinkedIn handle a large amount of incoming traffic. Events generated in response to user input or actions are stored in a source database. Though these events can be directly consumed by simply connecting to the source database where the events are first inserted, many of today's major web companies feature more complicated data flows, and so require database replications to isolate the consumers and source database.
*An extended version has been published in the 6th ACM/SPEC International Conference on Performance Engineering (ICPE 2015), Austin, TX, USA. (Slides in pdf)
Database Replication and Capacity Planning
Database replication is needed mainly for the following two reasons. First, the source database may need to be protected from heavy load. Having a database replication component can fan out database requests and isolate the source database from consumption. Secondly, when internet traffic is spread across multiple databases or multiple data centers, a converged and consistent data view is required. The database replication process has to be fast and incur low latency; this is important both for the benefits of the particular business and for enhanced user experience. Database replication latency is closely tied to capacity planning. We need to understand the relationship between incoming traffic volume, replication capacity, and replication latency for appropriate capacity planning.
In this post, I’ll discuss how we tried to reduce replication latency by developing two models for capacity planning. These models offer different levels of capacity planning accuracy and can be applied to different scenarios. We used the models on one of LinkedIn's database replication products to describe the designs and demonstrate usage, but the models can easily be applied to other similar usage scenarios. Moreover, our observations on internet traffic patterns can also help shed light on solving similar capacity planning problems in other areas.
Database replication
The following figure illustrates the typical data flow of event generation, replication, and consumption. When users interact with a web page, the corresponding user updates (events) are sent to databases. The events are replicated by a replicator and made available to downstream consumers.
Any event replicated by the events replicator has an associated replication latency due to transmission and processing. We define replication latency as the difference in time between when the event is inserted into the source database and when the event is ready to be consumed by downstream consumers. Minimizing the replication latency is always preferred from the business value perspective. While a user update that’s delayed can be a bit annoying (for example, newly updated expertise), other delayed updates can incur additional business cost or reduce business income. For example, with web sites that display customers' paid ads, the number of ad impressions (the number of times an advertisement is seen) across multiple data centers has to be tightly correlated to the budget. A significantly delayed ad event update will cause additional cost and reduced income for the company display the ads.
Capacity planning
To reduce database replication latency, appropriate capacity planning is required. Capacity planning will help understand the current business and operational environment, assess and plan for future application needs based on business forecasts. Capacity planning can help reduce the business operation cost. For example, given incoming traffic patterns, we can plan the replication capacity (hardware/software provisioning) so that replication latencies do not exceed business requirements. Though a naive solution is to provision resources to meet business SLAs such that the replication capacity always exceeds the peak traffic rates (for example, maximum replication latencies less than 10 minutes), it would incur unnecessary business cost. On the other hand, based on appropriate capacity planning models, it is possible to significantly reduce business cost without violating business SLAs.
By carefully considering both incoming traffic rate and replication capacity, we can also use capacity planning to foresee future replication latency values given a particular replication capacity. Moreover, most web companies' traffic also show an ever-growing traffic rate (i.e., producer rate), and we need to improve replication processing capacity to accommodate the traffic increase.
Specifically, the following two questions need to be answered for capacity planning:
- Replication latency prediction: given the incoming traffic rate and replication processing capacity, what are the expected replication latencies? This is important to determine the SLA of maximum replication latency value;
- Replication capacity determination: given the increased incoming rate and max-allowed replication latencies (SLA), how much replication capacity do we need to achieve? This will help define replication capacity requirements;
We attempted to answer these questions by analyzing production data and building two capacity planning models to address different usage scenarios:
- A numerical analysis model to accurately determine the replication capacity values;
- An approximation model that quickly determines approximate capacity planning values;
Each model has advantages and weaknesses, and we evaluated the effectiveness of both models in capacity planning for different scenarios.
In the following sections, I’ll describe how we evaluated the effectiveness of the models on LinkedIn's database replication protocol - Databus- and attempted to address the two questions.
LinkedIn Databus: Background
LinkedIn's Databus is a data replication protocol responsible for moving database events across data centers. It can also be used to fan out database usage to reduce the load on source databases. Replication is performed by the Databus Relay component, which takes incoming database records and gets them ready to be consumed by downstream Databus clients. A simple illustration of the data flow is shown below. The raw events are inserted into the source database, Espresso. These events are replicated and queued for Databus Relay to consume. Databus Relay fetches and processes the queued events so that the events can be pulled by the Databus clients.
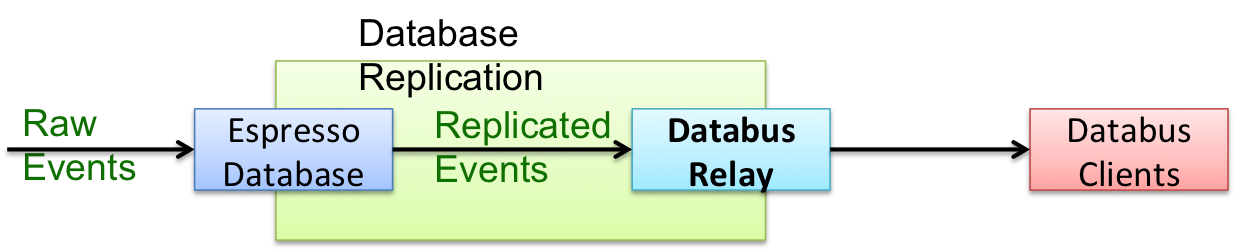 Figure 1: Data flow of Databus Relay
A critical performance factor is the Databus Relay Lag (Databus replication latency), which is calculated as the difference in time between when a record is inserted into the source database and when the record is ready to be consumed by the Databus clients. The extent of relay lag largely depends on two factors: the rate of incoming raw database events (i.e., the "producing rate" of the events) and the Databus Relay processing capacity (i.e., the "consuming rate" of the events). The Databus Relay is conceptually a queuing system and has the features of a single server, a First-In-First-Out (FIFO) queue, and infinite buffer size. So if the producing rate is always lower than the consuming rate, there will be no substantial relay lags, other than the event transmission delay which is usually very small. But when the producer overwhelms the consumer, the incoming events will be queued and a non-trivial relay lag will result due to an events queue backlog. To minimize relay lags, appropriate capacity planning is needed after careful consideration of both producing and consuming rates.
Our study of LinkedIn's production traffic showed that the producing rate -the incoming traffic rate - follows strong patterns in the form of repeated traffic curves, while the consuming rate - the relay capacity - is relatively constant. Because of varying incoming traffic rates, we saw that relay lag accumulates during peak hours when production rate is higher than the relay capacity, and the accumulated lag decreases during non-peak hours when the incoming traffic rate is lower than the relay capacity.
Observations of Databus Traffic and Processing Rates
Periodic pattern of incoming traffic rate
We first studied the incoming traffic rate of multiple Espresso instances across many months; our first impression was the strong periodic pattern - the traffic shape is repeated for each day of the week. The figure below shows 15 days of data between April 1, 2014 and April 15, 2014 for a single Espresso node. The incoming traffic consists of two types of database events: insert and update. Databus Relay processes both types of traffic; we aggregated the total incoming rate for each minute.
We observed weekly repeating patterns in incoming traffic rates. Every week, the five workdays have much more traffic than the two-day weekends. For example, for the weekdays of April 1, 2014 (Tuesday) to April 4, 2014 (Friday), the incoming rate was about 5000 events, while the two following weekend days only showed about 2000 events.
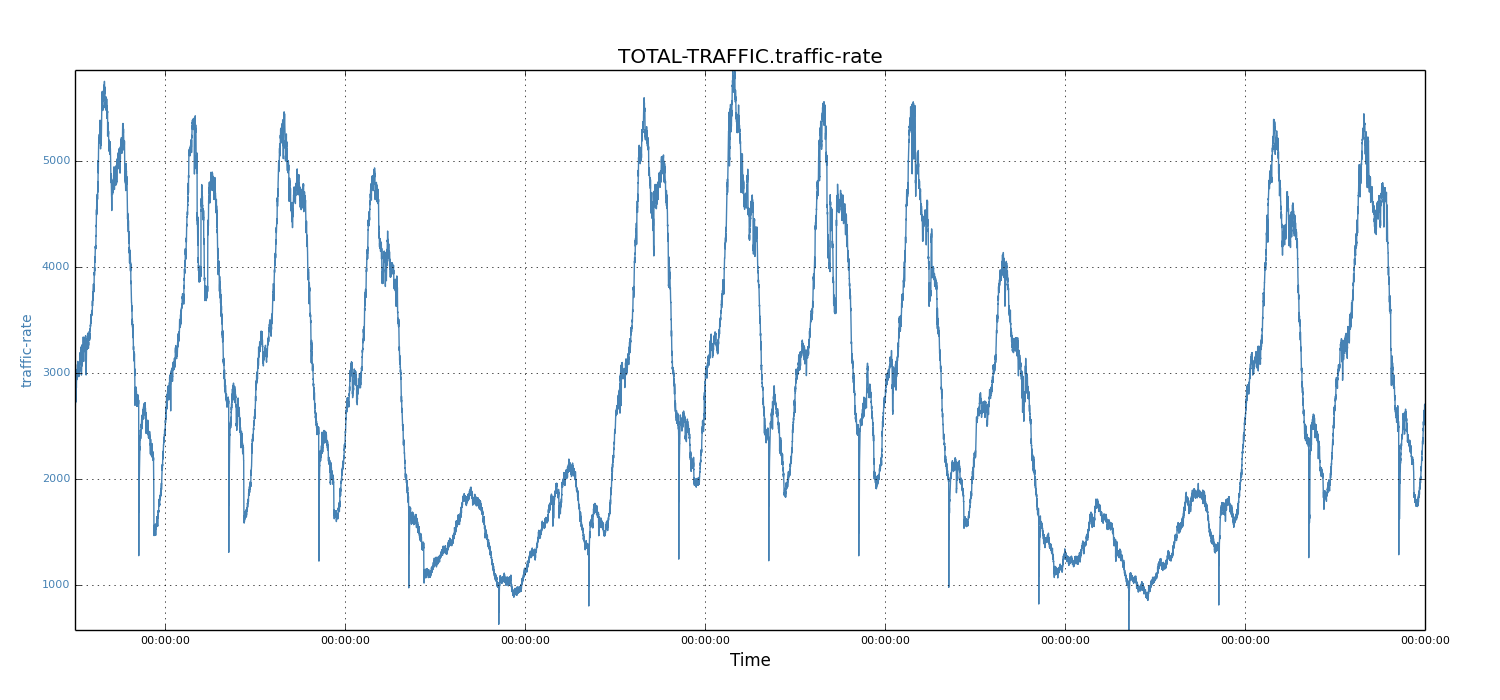 Figure 2: Traffic rate of 15 days
Incoming traffic of individual days
We then studied the periodic pattern of incoming traffic for each day. For each workday and weekend, we noticed that the traffic shape was a well formed curve. Below, we show the workday of April 15, 2014 (Tuesday) and the weekend day of April 5, 2014 (Saturday).
We observed that the traffic shapes of these two days were quite similar, except for the absolute values of each data point. Specifically, for each day, the peak periods were about 8 hours (that is, 6AM to 2PM in the West Coast, or 9AM to 5PM in the East Coast).
Not surprisingly, the workday peak value (5450 records) was much higher than that of weekends (1924 records). Because workdays see higher traffic rates than weekends and tend to build up larger relay lags, we focussed on workdays and used the weekday data to demonstrate our solution. However, note that the same solution also applies to weekends.
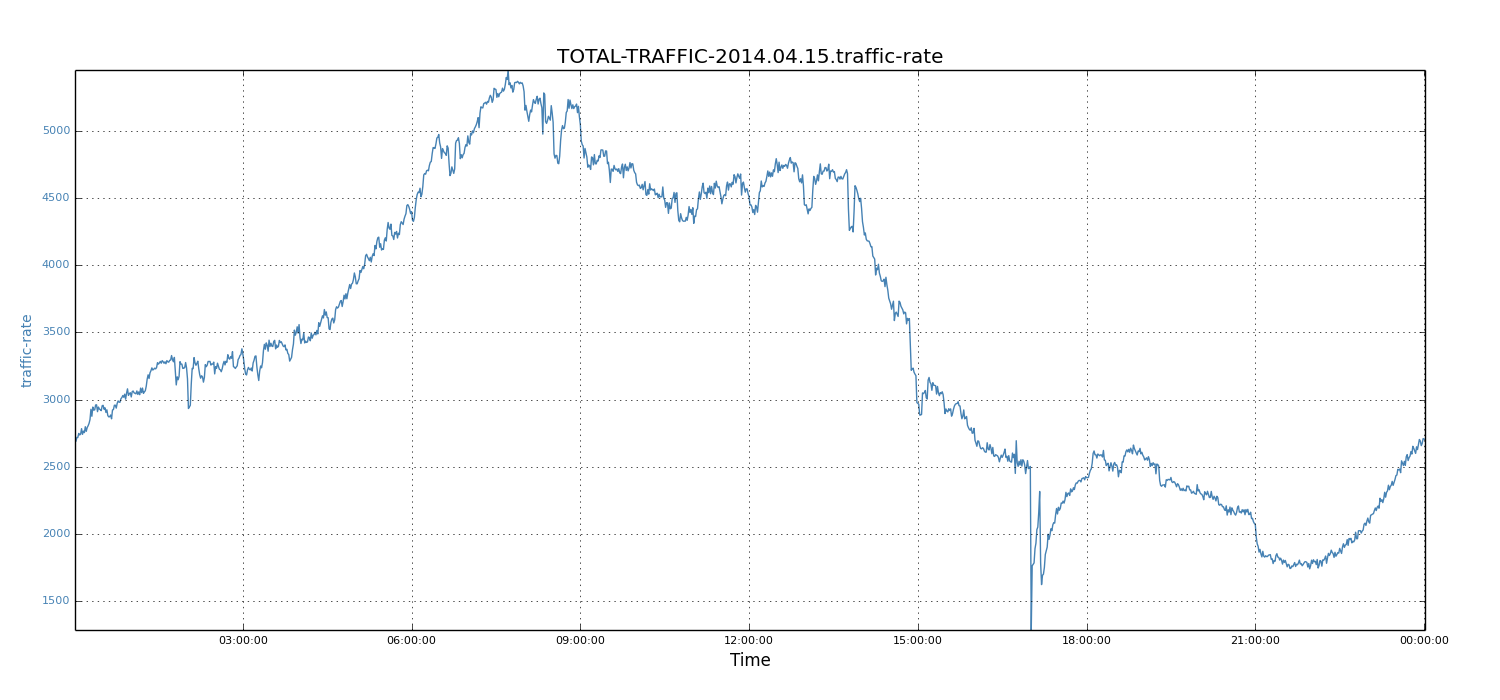 Figure 3: Traffic rate of 15-04-2014 (Tuesday)
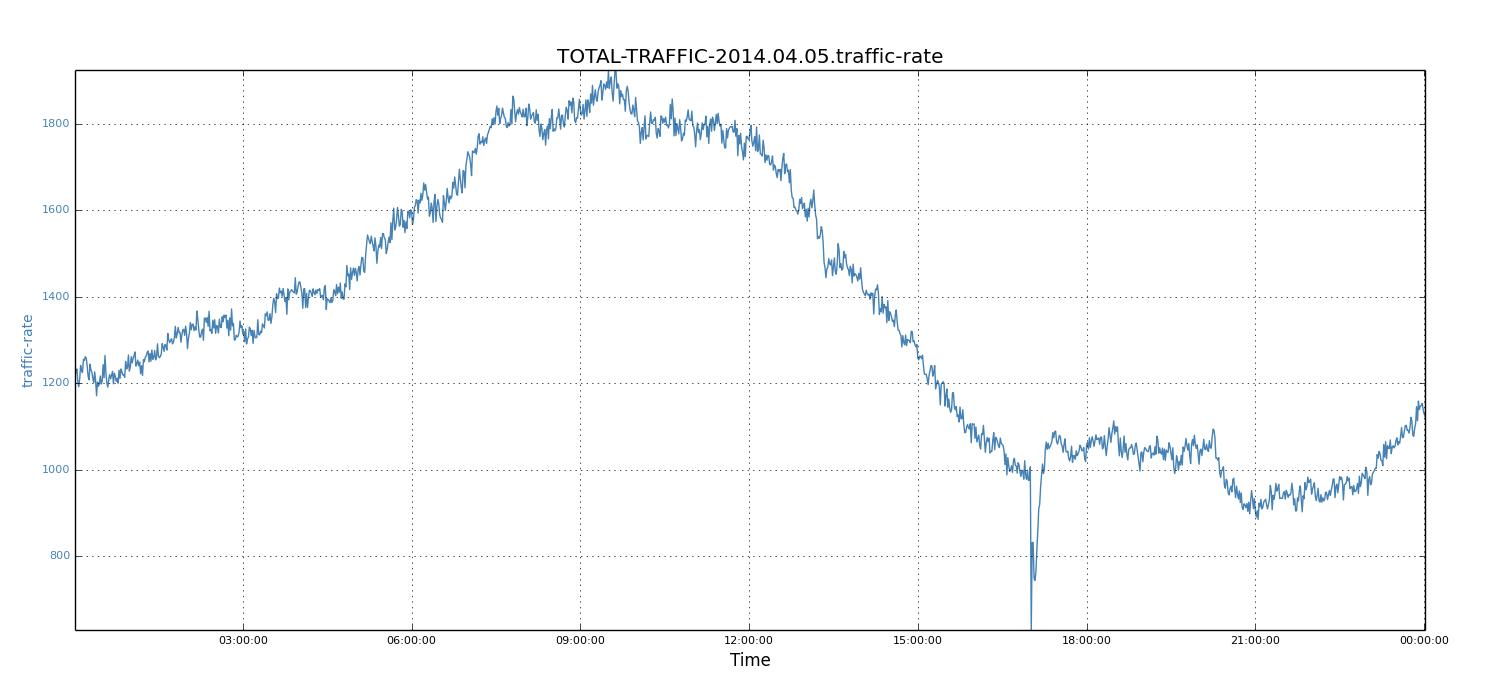 Figure 4: Traffic rate of 05-04-2014 (Saturday)
Relay processing capacity
We also examined the relay processing capacity. The relay rate was maximized only when there was a buildup in queued events. To force Databus Relay to work at full capacity, we rewound the starting System Change Number (SCN) of the relay component to artificially introduce sufficient relay lag. We observed that the relay processing rate is relatively flat at about 8K event/s. The reason for relative stable relay processing rate is because the processing rate is dominated by the replication protocol, which is relatively constant for each event.
Numerical Analysis Model
If the entire data set of incoming traffic rate is known, we can perform numerical analysis to answer the two questions related to capacity planning. The numerical analysis model can get accurate relay lag values. Moreover, this model can give the expected relay lag for any time of the day (e.g., every minute).
The method works as follows. Assuming the relay capacity is fixed and the average incoming traffic rate is lower than the relay capacity, we know there will be no relay lag from previous days because the entire events buildup will be processed during non-peak hours. Starting from time zero, for each time (e.g., minute) of the day, the incoming traffic rate is compared to the relay capacity. If the incoming rate is higher, it will incur relay lag at that time. Otherwise, previous relay lag, if any, will be decreased, as the relay has additional capacity to consume previously built-up lags. This process continues for each minute that follows, and the entire data set of relay lag is constructed.
Predicting relay lags
For relay lag prediction, we wanted to determine the maximum relay lag, given incoming traffic rates and relay capacity. Using the above numerical analysis-based method, we constructed the relay lag values for April 15, 2014. When the relay capacity was 7k events, the maximum lag was about 35 seconds.
To understand how well the numerical analysis model predicts relay lags, we compared the above results to real values. We choose one day of relay lags for a most stressed single Databus Relay instance as the base value. We fed the incoming traffic rates and relay capacity for that Relay instance into the numerical analysis model and then calculated the lag. The two sets of results are shown below. These results have almost identical shapes across the timeline. The absolute peak values are also very close (i.e., 376 vs. 240, less than 1.6X). Given the data complexities and variations in the production environment, we feel the accuracy of the numerical analysis model is satisfactory.
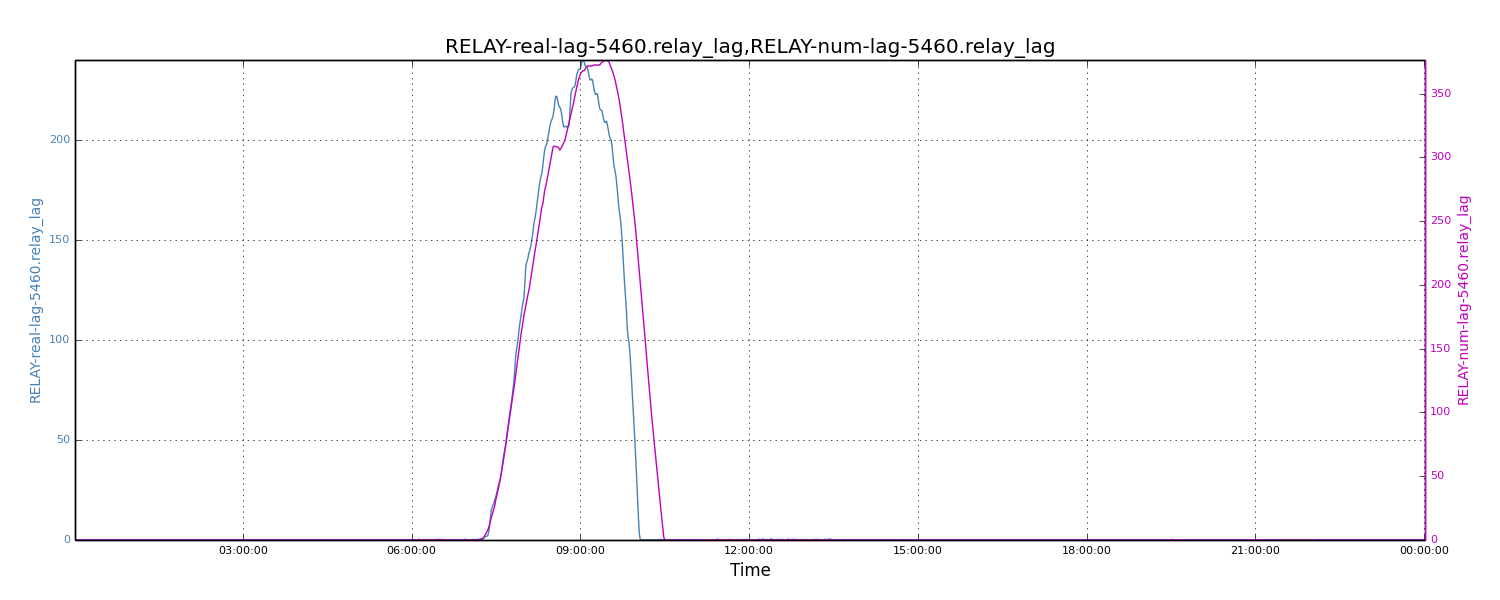 Figure 5: Comparing real relay lags to calculated lags
Determining relay capacity
Assuming the maximum allowed lag- the SLA - was 600 seconds, for the same day of April 15, 2014, we wanted to know what the required relay capacity would be to meet the SLA. With the numerical analysis model, we deduced that the required relay capacity requirement was about 5200 events. We assumed the incoming traffic rate would increase by 5X in the future; for the same SLA requirements, we wanted to calculate the required relay capacity (that is, relay processing rate). We scaled incoming traffic rate by 5X for each of the data points. Using the numerical analysis model, we found that the relay processing rate needed to be around 26K records.
 Figure 6: Relay lag when relay capacity is 26k events
Approximation Model
When only limited values of incoming traffic is known, while the full curves (i.e., the complete data points corresponding to the incoming traffic rates) are not available, it is difficult to perform numerical analysis. For this reason, we developed an approximation model to quickly perform capacity planning. This model requires peak traffic rates. When peak values are unknown, they can be approximated by scaling the average traffic rate. Based on past experience, for such web-type traffic rates, the rule of thumb is to scale average traffic rate by 1.5X to get peak traffic rate. In the following scenario, we chose the date of April 15, 2014 and plotted the complete data sets and the average traffic rate.
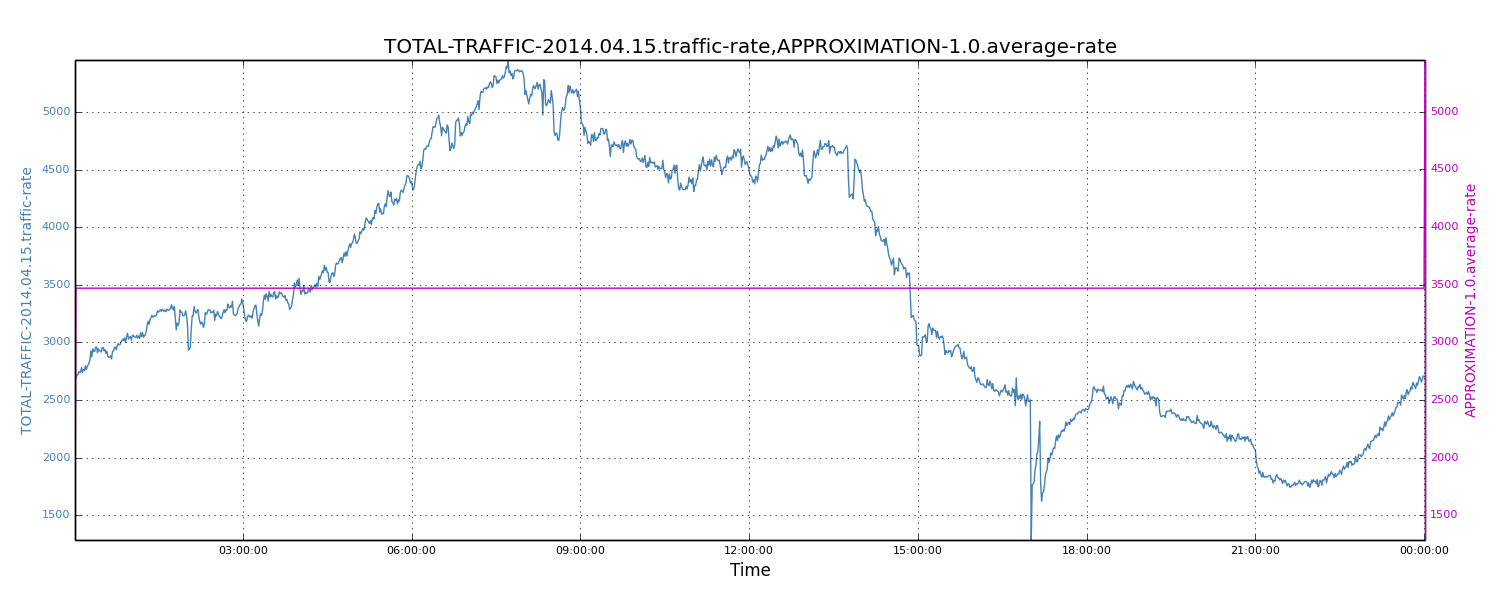 Figure 7: Average traffic rate
We also plotted the complete data set and the 1.5X-scaled average traffic rate. We see that 1.5X-scaled average traffic roughly equals peak traffic rates.
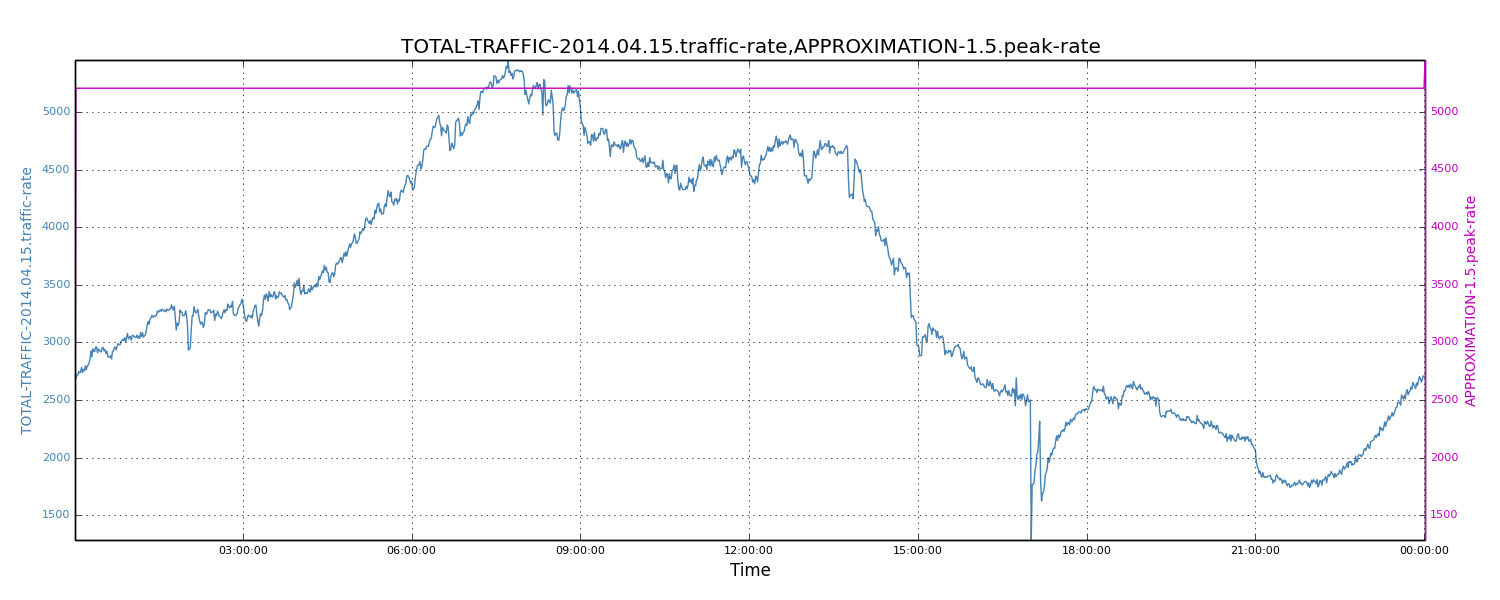 Figure 8: Approximated peak traffic rate
Once we know the incoming peak traffic rate, we assume the peak hours will last for about 8 hours (corresponding to the typical business hours). We denote these 8 hours as "peak period". To estimate the maximum relay lag, we also need to know the non-peak incoming traffic rate. For simplicity, we approximate the non-peak rate by halving the average traffic rate.
Let R_cap be the relay capacity (e.g., 6K event/s), R_avg be the average incoming traffic rate, R_peak be the peak traffic rate, R_npeak be the non-peak traffic rate, and Pe be the duration of peak period; we can deduct the maximum relay lag (denoted by Lag_m) by Lag_m = (R_peak - R_cap)*Pe / (R_cap - R_npeak). Note that (R_cap - R_npeak) gives the extra consumption rate that drains the previous event lag. Let R_peak = 1.5*R_avg and R_npeak=0.5*R_avg. Also assume R_cap and R_avg are measured in seconds. The equation becomes Lag_m = (1.5*R_avg - R_cap)*8*3600 / (R_cap - 0.5*R_avg).
Specifically, for the day of April 15, 2014, the average traffic rate was 3470 events. The peak_rate was 5205 records, while the non_peak_rate was 1735 records. With 5K events relay capacity, the maximum relay lag was about 1808 seconds. We noticed that the maximum lag value from the approximation model was comparable to the numerical analysis model. The values obtained by the approximation model were about 1.7X of the numeric calculations (i.e., 1808 vs. 1071 seconds). We concluded that the approximation model is a great way to quickly estimate relay lag values.
With the above equation, we can similarly address capacity. The corresponding solutions only need a simple linear transformation of variables. Specifically, to determine the needed relay capacity, we use R_cap = (43200+0.5*Lag_m)*R_avg/(28800+Lag_m).
Conclusion
We proposed two models for database replication capacity planning: The numerical analysis model, which is the most accurate and detailed, uses the entire data set of incoming traffic to deduce relay lag. The approximation model does not need complete data points of incoming traffic, and is the fastest model. It also allows back-of-the-envelope calculation and works reasonably well for capacity planning purposes.
Currently our models simply assume that the replication capacity (e.g., the relay processing rate) is fixed. Though it is a reasonable assumption, in reality, the actual replication processing rate also depends on other factors. It is possible to modify the proposed models by incorporating these variations. To further increase the accuracy of the prediction, other statistics-related techniques such as time-series can be applied to get a more accurate regression model.
Moreover, though this work is specific to database replication capacity planning, the observations we made regarding traffic patterns and the models we proposed can help solve similar problems in other areas such as online log processing.
Acknowledgements
Special thanks to Cuong Tran, Haricharan Ramachandra, Subbu Subramaniam, Chavdar Botev, and Sajid Topiwala for their help on revealing, analyzing, and solving this problem. The graphs were generated by the performance analysis tool Naarad; many thanks to the developers.